Last June, I discussed the merits of The Grinder as a Load testing tool, and
compared it with Load Runner and JMeter. Since then, I have been using The Grinder at work to perform load tests against our server product. In the nearly five months since my original analysis, all of my serious complaints have been addressed. In addition, several of my minor ones have been addressed as well, or workarounds have been discovered. So I thought it would be fair to revisit my original complaints, and in the cases where solutions have been found, share them.
Major Issues
Poor performance with large downloads.
This turned out to be a memory issue driven by my poor configuration. The Grinder does not have the option of eating the bytes of the HTTP response as it is coming in, or of spooling it off to disk. It keeps the entire body of the response in memory until the download is complete. In my test, I was requesting a web resource that was very large (4MB - 6MB). With its default heap size, and many threads running simultaneously, the agent process simply could not handle this level of traffic.
The trick was in how to give the agent more heap. The standard technique -- passing in heap-related arguments (-Xms, -Xmx) to the JVM when starting the agent was having no effect. This is because the main Java process spawns new Java instances to do the actual work, and these sub-instances had no knowledge of my settings. To pass these heap arguments to the JVM sub-processes, add a line to your grinder.properties file, and everything will work well:
grinder.jvm.arguments=-Xms300M -Xmx1600M
In the original post, there was some discussion about using native code such as libcurl to do the heavy-lifting here, but fortunately that has proven not to be necessary..
Minor Issues
Bandwidth Throttling / Slow Sockets
Bandwidth throttling, AKA slow sockets, is the name for a feature that allows each socket connection to the server to communicate at a specified bitrate, as opposed to downloading everything at wire speed as fast as possible. This is desirable because for any given level of transactions per second, the server will be working harder if it is servicing a large number of slow connections as opposed to a small number of very fast connections. So this allows the load tester to set up a far more realistic scenario, modeling the real-world use of many devices with varying network speeds connecting to the server.
And there is good news on this issue. By request, Phil Aston, the primary developer of The Grinder, has implemented this feature. I tested early Grinder builds with this feature, and am happy to say with confidence that the current implementation behaves correctly, is robust, and scalable. Awesome.
The feaure is implemented as method HTTPPluginConnection.setBandwidthLimit -- details here:
http://grinder.sourceforge.net/g3/script-javadoc/net/grinder/plugin/http/HTTPPluginConnection.html#setBandwidthLimit(int)
Load Scheduling
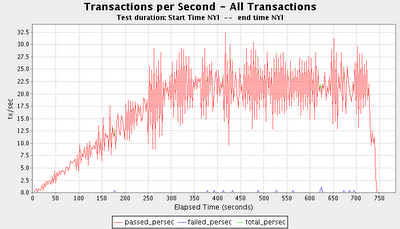
There is still not full-on load scheduler for The Grinder like there is for Load Runner. Thread execution is all or nothing. However, there is a neat little workaround that takes away most of the sting. If you just want your threads to ramp in smoothly over time in a linear fashion, you can have each thread sleep for a period of time before beginning execution, with higher-numbered threads sleeping progressively longer.
Be sure the module containing your TestRunner class imports the grinder:
from net.grinder.script.Grinder import grinder
Then put this code into the __init__ method of your TestRunner class:
      # rampTime is defined outside this snippet, it is the amount
      # of time (in ms) between the starting of each thread.
      sleepTime=grinder.threadID * rampTime
      grinder.sleep( sleepTime, 0 )
Results Reporting
The Grinder's results reporting an analysis features are weak. I am currently working on a data-warehousing system that stores the transaction data from each run, enabling detailed post-run processing and analysis. Details in subsequent blog entries.
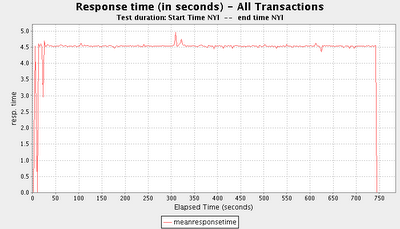
 Here is an example of a response times graph generated by the current code:
 Future - Short Term
In the short term, this basic functionality must be completed.