The Grinder is a good tool for generating large levels of load against a server. But after the run is over, the love ends. There are no post-run analysis capabilities built in. No graphs of server-side performance metrics, or clients side data.
I have begun working on an open-source data warehousing tool for test data generated by The Grinder. This tool parses the logs generated by each agent, and feeds all the information into a database. Once it has been centralized there, all sorts of post-run analysis becomes possible. I have two goals for this project:
- Allow for simple analysis of Grinder runs: generate summary tables, graph server-side perf data such as CPU and disk activity, graph client side data such as response times and transactions per second.
- Allow for long-term storage of test data. This will enable comparing performance of the server across many different builds, and longer-term, across many different server versions.
Current Situation
Here is what is implemented today:
- The database -- tables
- The database -- sql scripts to generate TPS and response time graphs
- The log parser and feeder classes which run on each agent
- The grapher classes
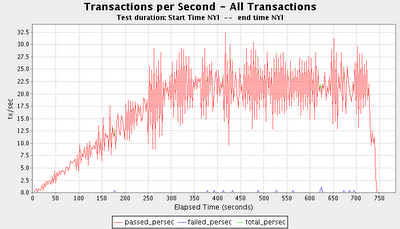
This is an example of a transactions per second graph generated by the current code. In this scale run, the load was increasing over time (using the scheduling mechanism discussed at the end of
my previous blog entry.)

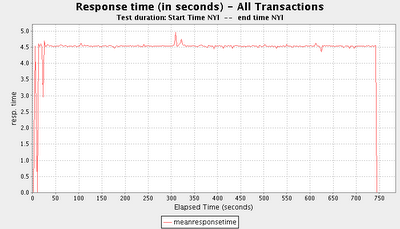
Here is an example of a response times graph generated by the current code:
 Future - Short Term
In the short term, this basic functionality must be completed.
- SQL code to generate reports summarizing a given scale run. Presenting information on response times, pass/fail rates, etc. in a tabular format.
- Create feeders and graphers for server-side performance data, such as produced by perfmon, vmstat, sar, prstat, etc.
Future - Medium Term
After the immediate needs are met, a good way of browsing the test results in the database is needed.
- Storing the graphs themselves in the database rather than on the filesystem.
- Implementing a Web UI for browsing scale test info in the database
Future - Long Term
Currently, running a large-scale test with many agents is a cumbersome process. Each agent process must be manually started and connected to the console. In situations with, for example, 30 agent machines, this is problematic. Shell scripts exist today that can ssh in to remote agents and start them up, but they require Linux and are not a generic, cross-platform solution.
- Extending the web UI to provide additional configuration management.
- Extending the web UI to enable remote agent startup in a cross-platform manner, and the ability to drive a Grinder test in an AJAX environment via the console API.
 Here is an example of a response times graph generated by the current code:
 Future - Short Term
In the short term, this basic functionality must be completed.
8 comments:
You use matplotlib for graphing, don't you?
Actually, it's all done in Java -- data is accessed via simple JDBC, and graphed with the excellent JFreeChart library.
Hi Travis.
I was wondering how your project was going, and if you managed to upload it somewhere? sourceforge ad code.google.com projects are pretty easy to setup.
regards
Ian
Thanks for asking, Ian. I definitely need to post the code somewhere. Unfortunately, it's not quite ready for non-expert users yet. The amount of time I can work on this is largely dictated by my work schedule, which is pretty full until near the end of next month.
It still needs documenting and some basic polish. If you are comfortable with bash scripting, SQL, and Java, let me know and I'll send you what I have directly.
Hi Travis,
I must say I found this comparative analysis to be really helpful. I am going through some of the similar pains of needing to shell out > 50K for running users *once* (VU Days). I and my team have also settled on Grinder finally but were struggling with some of the results and analysis portion of things. Is there any way you can share some of the code and wisdom? We are fairly proficient in bash/SQL/java so, reading code shouldn't be an issue.
Please let me know.
Thanks & regards
=KK
I have created a project on sourceforge and uploaded the existing code. As I mentioned earlier, there is a lot of poorly-documented config involved in getting it running, so it's not yet in a state where it's useful to non-developers.
The sourceforge page is here:
https://sourceforge.net/projects/track/
SVN access is here:
svn co https://track.svn.sourceforge.net/svnroot/track track
Thanks Travis. Will check this out.
-KK
very interesting post.this is my first time visit here.i found so many interesting stuff in your blog especially its discussion..thanks for the post! centralized structured logs for .NET
Post a Comment